Calculating Cost Per Engagement for Influencer Campaigns
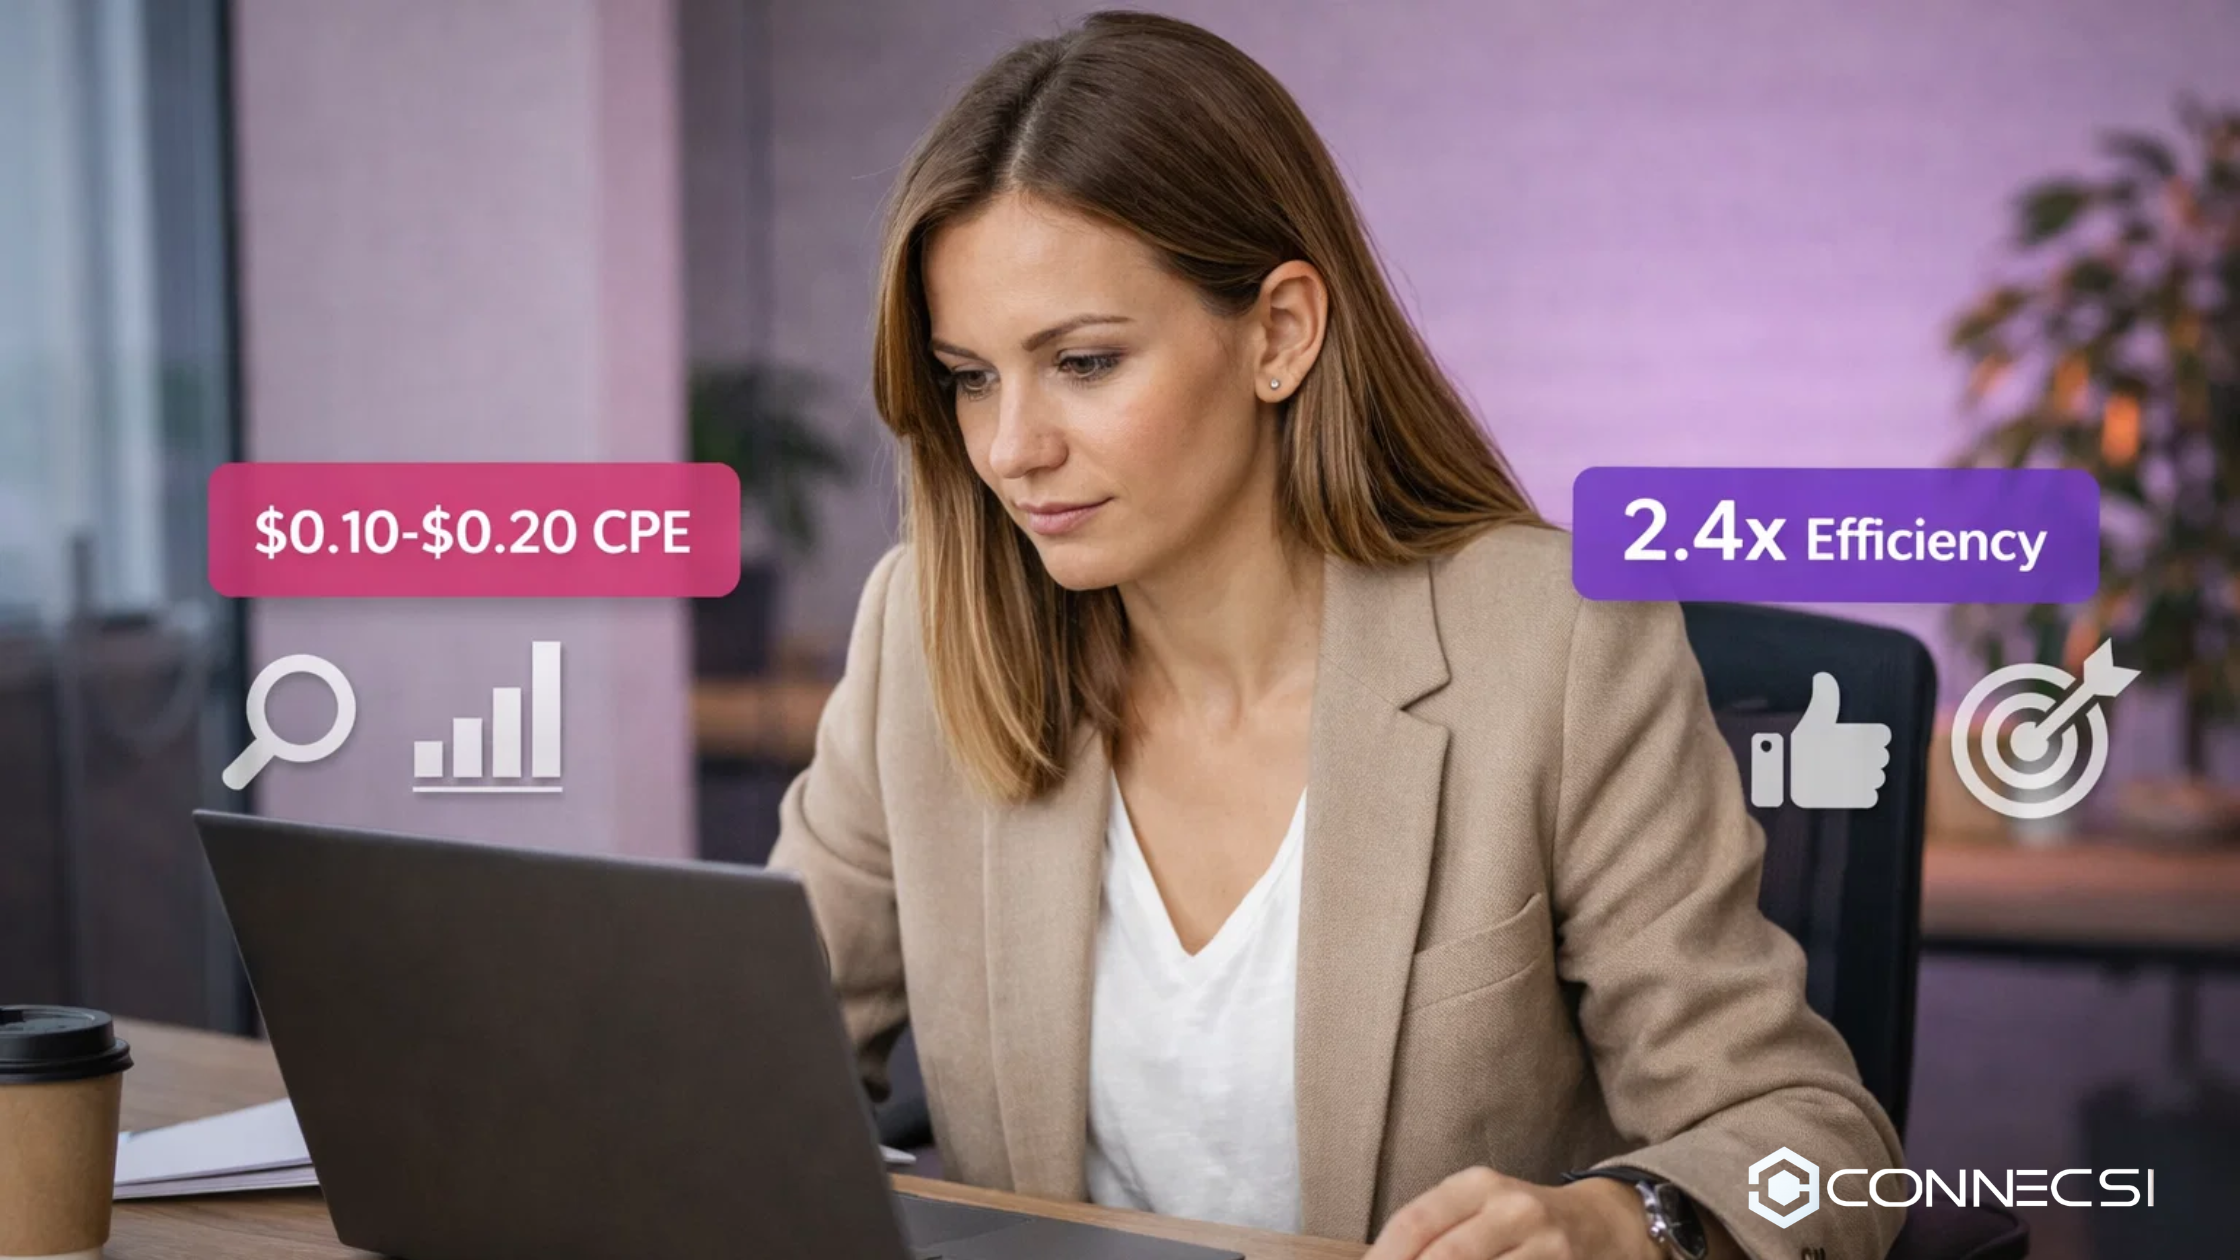
Understanding cost per engagement (CPE) transforms influencer marketing from creative guesswork into data-driven performance optimization. While follower counts and impressions create illusions of reach, engagement—likes, comments, shares, saves—reveals genuine audience interest and interaction. Calculating what you pay for each engagement enables precise campaign comparison, creator evaluation, and budget allocation decisions based on efficiency rather than vanity metrics. Yet 54% of brands never calculate CPE, missing the efficiency metric that separates high-performing partnerships from budget-wasting ones.
According to Statista's influencer marketing benchmarks, brands tracking cost per engagement achieve 2.4x better budget efficiency than those optimizing solely for reach or impressions. CPE reveals which creator tiers, platforms, and content types deliver engagement most cost-effectively—insights enabling strategic budget reallocation from expensive underperformers to efficient high-performers.
This guide provides step-by-step CPE calculation formulas, platform-specific benchmarks, tier comparison analysis, and optimization strategies for improving engagement efficiency. We'll explore how CPE differs from cost per click and cost per conversion, when to prioritize engagement over other metrics, and how to use CPE data for creator selection and campaign refinement.
💡 Pro Tip
Track CPE alongside cost per click and cost per conversion, not instead of them. Engagement indicates interest, clicks show action intent, and conversions prove business impact. Optimize for engagement efficiency when building awareness, but prioritize conversion metrics when driving sales.
The Cost Per Engagement Formula
Cost per engagement calculates how much you spend to generate one interaction, using the formula: Total Campaign Cost / Total Engagements = Cost Per Engagement. If you spend $1,000 on an influencer partnership that generates 5,000 engagements (likes, comments, shares, saves), your CPE is $0.20—you paid 20 cents for each audience interaction.
Total campaign cost includes all expenses: influencer payment, product seeding costs, platform fees, and content production expenses if applicable. Many brands undercount costs by excluding product value or platform fees, artificially deflating CPE and creating misleading efficiency calculations. Accurate cost accounting ensures realistic performance assessment.
Total engagements sum all interaction types: Instagram likes, comments, shares, and saves; TikTok likes, comments, and shares; YouTube likes, comments, and shares. Some brands count only likes, dramatically undercounting actual engagement. Include all interaction types for comprehensive CPE calculation. According to Later's engagement analysis, saves and shares often indicate higher intent than passive likes, making their inclusion essential for accurate measurement.
Calculate CPE per creator, per platform, and per content type to identify efficiency patterns. A creator with $500 cost generating 3,000 engagements ($0.17 CPE) outperforms one with $800 cost generating 3,200 engagements ($0.25 CPE) despite similar absolute engagement numbers.
CPE Benchmarks by Influencer Tier
Cost per engagement varies dramatically across influencer tiers, with smaller creators typically delivering better efficiency than larger ones despite lower absolute reach.
Nano influencers (1,000-10,000 followers) average $0.10-$0.20 CPE. A nano creator charging $150 with 5,000 followers achieving 12% engagement generates approximately 600 interactions, resulting in $0.25 CPE. Many nano partnerships using product-only compensation achieve near-zero CPE when product costs are minimal.
Micro influencers (10,000-100,000 followers) average $0.20-$0.40 CPE. A micro creator with 40,000 followers charging $800 and achieving 9% engagement generates 3,600 interactions at $0.22 CPE—competitive efficiency at significantly higher scale than nano creators.
Macro influencers (100,000-1,000,000 followers) typically deliver $0.40-$0.80 CPE. Lower engagement rates (2-4%) combined with higher costs ($2,500-$15,000) create less efficient engagement economics. A macro creator with 500,000 followers charging $5,000 achieving 3% engagement generates 15,000 interactions at $0.33 CPE—better absolute engagement but comparable or worse efficiency than micro creators.
These benchmarks explain why brands increasingly allocate budgets toward nano and micro tiers. A $5,000 budget funds 1 macro influencer or 6-8 micro influencers or 25-30 nano influencers. While the macro creator delivers largest single-partnership reach, distributed nano/micro strategies often achieve better overall CPE and total engagement through volume and efficiency. For detailed tier performance analysis, review our comparison of nano versus micro influencer effectiveness.
| Tier | Typical CPE | Engagement Rate | Best For |
|---|---|---|---|
| Nano | $0.10-$0.20 | 10-15% | Budget efficiency |
| Micro | $0.20-$0.40 | 8-10% | Scale + efficiency |
| Macro | $0.40-$0.80 | 2-4% | Maximum reach |
Platform-Specific CPE Differences
Engagement costs vary across platforms due to different user behaviors, algorithm mechanics, and content consumption patterns.
Instagram typically delivers $0.20-$0.35 CPE for micro influencers. Feed posts generate steady engagement, Stories create ephemeral interactions, and Reels benefit from algorithm promotion driving discovery. Instagram's mature influencer ecosystem means competitive pricing but proven engagement patterns.
TikTok often achieves $0.15-$0.30 CPE, slightly more efficient than Instagram due to algorithm-driven discovery giving even smaller creators viral potential. TikTok's engagement-focused design (prominent like/comment/share buttons) encourages interaction, often producing higher engagement rates than other platforms.
YouTube shows higher $0.40-$0.70 CPE because video production requires more effort and time, justifying higher creator fees. However, YouTube engagement (likes, comments, shares) indicates deeper investment than passive Instagram likes—viewers spending 10 minutes watching content demonstrate stronger interest than those scrolling past an image.
X (formerly Twitter) and LinkedIn see varied CPE depending on niche and audience size, generally falling between $0.25-$0.50. Professional audiences on LinkedIn may engage less frequently but with higher quality, while X's fast-moving feed creates engagement volatility.
Platform selection should consider CPE alongside other metrics. TikTok's lower CPE matters less if your target customers don't use TikTok. Instagram's slightly higher CPE is worthwhile if audience demographics align perfectly with target customers. For guidance on platform performance comparison, explore our analysis of influencer tier effectiveness across channels.
CPE vs. Other Performance Metrics
Cost per engagement represents one metric in a comprehensive performance measurement framework. Understanding when to prioritize CPE versus cost per click (CPC) or cost per conversion (CPA) depends on campaign objectives.
Cost per engagement measures interaction cost—best for awareness campaigns where building familiarity and consideration matters more than immediate action. If campaign goals include brand awareness, product education, or community building, optimize for CPE alongside reach.
Cost per click measures how much you pay for website traffic—essential for consideration and conversion campaigns. A partnership with $0.15 CPE but $2.50 CPC indicates high engagement that doesn't translate to website visits. If driving traffic is the objective, optimize for CPC over CPE.
Cost per conversion measures acquisition cost—the ultimate metric for sales-driven campaigns. CPE and CPC might look efficient, but if cost per conversion is $85 when customer lifetime value is $60, campaign economics don't work regardless of engagement efficiency.
The metric hierarchy typically flows: awareness campaigns prioritize CPE and reach, consideration campaigns optimize for CPC and engagement quality, conversion campaigns focus on CPA and revenue attribution. Track all three metrics but emphasize the one matching campaign objectives. Connecsi's performance dashboards automatically calculate CPE, CPC, and CPA across all influencer partnerships, enabling comparison and optimization based on campaign goals. For comprehensive metric frameworks, review our guide on influencer marketing metrics that matter.
Using CPE for Creator Selection
Cost per engagement data from past campaigns informs future creator selection, helping brands identify high-efficiency partners and avoid expensive underperformers.
Maintain a creator performance database tracking CPE alongside engagement rate, conversion rate, and ROI per influencer across all partnerships. Creators consistently delivering $0.15-$0.20 CPE while tier average is $0.30 represent exceptional value deserving increased budget allocation and longer partnerships.
Before committing to new creators, estimate predicted CPE using formula: (Proposed Cost) / (Followers × Expected Engagement Rate) = Predicted CPE. If a creator with 30,000 followers quotes $600 and historically achieves 9% engagement, predicted CPE is $600 / 2,700 = $0.22. Compare this against tier benchmarks and your historical data determining if pricing is competitive.
Negotiate rates when predicted CPE significantly exceeds benchmarks. If a creator's rate produces $0.45 predicted CPE while comparable creators deliver $0.25, counter-offer with rate producing competitive CPE. Many creators negotiate, especially if you provide data showing market rates. For comprehensive creator evaluation criteria, review our guide on vetting influencers before partnerships.
Improving Campaign CPE Over Time
Cost per engagement improves through systematic testing, creator portfolio optimization, and strategic budget reallocation based on performance data.
Shift budget toward efficient performers: If nano creators deliver $0.18 average CPE while macro creators cost $0.52 CPE, reallocating 30% of macro budget to nano partnerships improves overall campaign efficiency even if sacrificing some total reach.
Test content formats: Video content might cost more to produce but generate 2x engagement of static images, resulting in better CPE despite higher upfront cost. Track CPE by format identifying which types deliver best engagement efficiency for your specific audience. Content performance optimization strategies provide additional frameworks for improving engagement efficiency across formats.
Optimize posting timing: Content posted at optimal times when audiences are most active generates higher engagement at identical cost, automatically improving CPE. Test different posting schedules measuring engagement impact.
Refine creator vetting: Analysis might reveal creators with 60-70% authentic followers deliver worse CPE than those with 90%+ authentic audiences. Stricter authenticity requirements during vetting prevents partnerships with inflated follower counts producing expensive low-engagement results. For vetting best practices, explore our comprehensive ROI tracking guide covering authenticity verification.
Build long-term relationships: Creators often improve performance in second and third partnerships as they better understand your brand and audience. First collaboration CPE of $0.35 might improve to $0.22 in subsequent partnerships as creators refine content approaches.
Common CPE Calculation Mistakes
Several predictable errors distort CPE calculations and lead to poor optimization decisions.
Excluding product costs: Counting only cash payment while ignoring $100 product value understates true cost, making CPE appear artificially low. Include all expenses in cost calculations for accuracy.
Counting only likes: Instagram posts might generate 2,000 likes but also 150 comments, 80 saves, and 45 shares. Counting only likes calculates CPE at $0.25 when true CPE including all engagement is $0.22—seems minor but compounds across campaigns. Comprehensive engagement tracking ensures accurate CPE calculations across all interaction types.
Comparing CPE across objectives: Awareness campaign CPE of $0.18 isn't directly comparable to conversion campaign CPE of $0.35 if conversion content includes strong CTAs reducing passive engagement. Compare CPE within similar campaign types, not across different objectives.
Optimizing CPE while ignoring quality: A creator delivering $0.10 CPE from engagement pods and fake accounts provides no real value despite impressive efficiency numbers. Always verify engagement authenticity before celebrating low CPE.
Setting arbitrary CPE targets: Deciding "we want $0.20 CPE" without industry context creates unrealistic expectations. Research tier and platform benchmarks setting achievable targets based on market realities rather than wishful thinking. Industry pricing benchmarks provide essential context for setting realistic CPE goals.
Key Takeaways
- Calculate CPE using Total Cost / Total Engagements—include all expenses and interaction types
- Nano influencers average $0.10-$0.20 CPE versus micro's $0.20-$0.40 and macro's $0.40-$0.80
- Track CPE alongside CPC and CPA—optimize for engagement in awareness campaigns, clicks for consideration
- Brands tracking CPE achieve 2.4x better budget efficiency than reach-only optimization
- Improve CPE by shifting budget to efficient creators and building long-term partnerships
Conclusion
Cost per engagement transforms influencer marketing budget allocation from guesswork into data-driven optimization. The 2.4x efficiency improvement that CPE tracking delivers comes from identifying which creators, platforms, and content types generate engagement most cost-effectively—then systematically reallocating budget toward high performers and away from expensive underperformers.
Calculating CPE takes minutes but reveals insights that save thousands. When you discover nano creators delivering $0.18 CPE while macro partnerships cost $0.52 CPE, budget reallocation decisions become obvious. When platform comparison shows TikTok achieving $0.22 CPE versus Instagram's $0.34, channel strategy clarifies immediately. When content analysis reveals video generating 40% lower CPE than static posts, creative direction aligns with data.
Track CPE alongside click and conversion metrics, not instead of them—each serves different campaign objectives. Awareness builds through engagement, consideration grows through clicks, and revenue flows from conversions. Optimize for the metric matching your goal, measure the others for context, and use comprehensive data to continuously improve efficiency across all performance dimensions. Integrated measurement frameworks help balance CPE with other critical performance indicators.
Ready to optimize influencer marketing efficiency? Connecsi automatically calculates cost per engagement, cost per click, and cost per conversion across all creator partnerships—providing real-time efficiency metrics that identify top performers and guide budget allocation toward highest-ROI influencers and platforms.
More insights for you.

What Your Favorite Creators Actually Earn: Inside the Highest Paid Creators of 2026
MrBeast made $300M. Another creator made $31M from just 10 million followers. Here's what the top 10 actually sell, and the do's and don'ts to borrow.

Your UGC Portfolio: You Need 5 Videos Before Any Brand Will Pay You
Most new creators pitch with nothing attached and blame a saturated market. Five sample videos changes every conversation. Here's exactly what to shoot.

Influencer Marketing Attribution: Why You Still Can't Prove What Worked
Your finance lead asks which sales came from creators. Most brands can't answer. Here's why the tracking breaks, and the stack that actually holds up.
Fresh insights.
Straight to your inbox.
- Creator partnerships
- Campaign guidance
- Industry insights